Convert a Pedigree to a data frame with all the elements and their
characteristic for them to be plotted afterwards with
plot_fromdf().
Usage
# S4 method for class 'Pedigree'
ped_to_plotdf(
  obj,
  packed = TRUE,
  width = 6,
  align = c(1.5, 2),
  align_parents = TRUE,
  force = FALSE,
  cex = 1,
  symbolsize = cex,
  pconnect = 0.5,
  branch = 0.6,
  aff_mark = TRUE,
  id_lab = "id",
  label = NULL,
  precision = 4,
  lwd = 1,
  tips = NULL,
  ggplot_gen = FALSE,
  label_dist = c(1, 3, 5),
  label_cex = c(1, 0.7, 1),
  ...
)
Arguments
- obj
A Pedigree object
- ...
Other arguments passed to
par()- packed
Should the Pedigree be compressed. (i.e. allow diagonal lines connecting parents to children in order to have a smaller overall width for the plot.)
- width
For a packed output, the minimum width of the plot, in inches.
- align
For a packed Pedigree, align children under parents
TRUE, to the extent possible given the page width, or align to to the left marginFALSE. This argument can be a two element vector, giving the alignment parameters, or a logical value. IfTRUE, the default isc(1.5, 2), or if numeric the routinealignped4()will be called.- align_parents
If
align_parents = TRUE, go one step further and try to make both parents of each child have the same depth. (This is not always possible). It helps the drawing program by lining up pedigrees that 'join in the middle' via a marriage.- force
If
force = TRUE, the function will return the depth minusmin(depth)ifdepthreach a state with no founders is not possible.- cex
Character expansion of the text
- symbolsize
Size of the symbols
- pconnect
When connecting parent to children the program will try to make the connecting line as close to vertical as possible, subject to it lying inside the endpoints of the line that connects the children by at least
pconnectpeople. Setting this option to a large number will force the line to connect at the midpoint of the children.- branch
defines how much angle is used to connect various levels of nuclear families.
- aff_mark
If
TRUE, add a aff_mark to each box corresponding to the value of the affection column for each filling scale.- id_lab
The column name of the id for each individuals.
- label
If not
NULL, add a label to each box under the id corresponding to the value of the column given.- precision
The number of significatif numbers to round the solution to.
- lwd
default=1. Controls the line width of the segments, arcs and polygons.
- tips
A character vector of the column names of the data frame to use as tooltips. If
NULL, no tooltips are added.- ggplot_gen
If
TRUE, the function will use theggplot2package to generate the plot.- label_dist
A numeric vector of length 3 giving the distance between the id, date and label text and the bottom of the box. This value is multiplied by the obtained
labhvalue.- label_cex
A numeric vector of length 3 giving the cex of the id, date and label text. This value is multiplied by the
cexargument
Details
The data frame contains the following columns:
x0,y0,x1,y1: coordinates of the elementstype: type of the elementsfill: fill color of the elementsborder: border color of the elementsangle: angle of the shading of the elementsdensity: density of the shading of the elementscex: size of the elementslabel: label of the elementstips: tips of the elements (used for the tooltips)adjx: horizontal text adjustment of the labelsadjy: vertical text adjustment of the labels
All those columns are used by
plot_fromdf() to plot the graph.
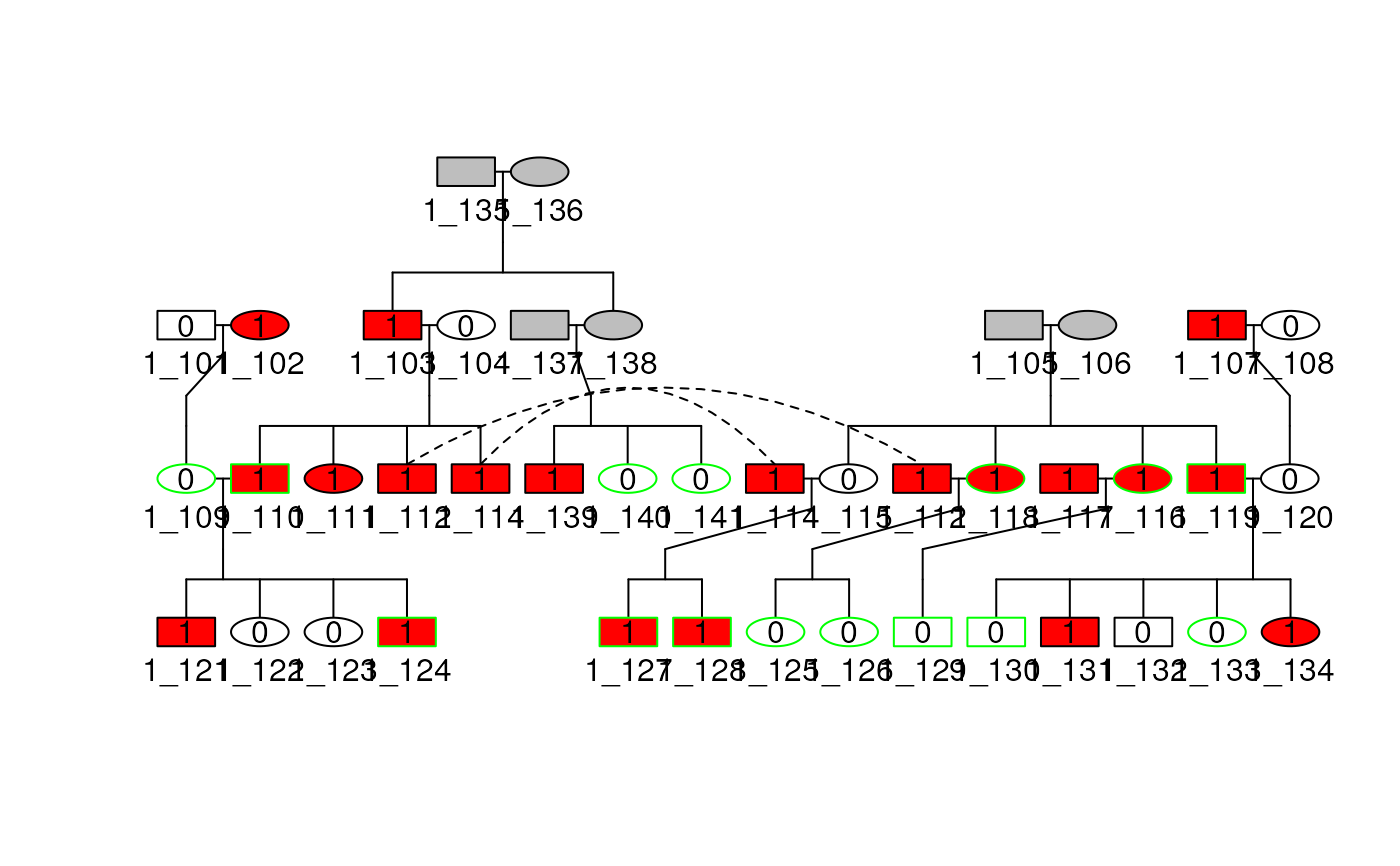
Examples
data(sampleped)
ped1 <- Pedigree(sampleped[sampleped$famid == 1,])
plot_df <- ped_to_plotdf(ped1)
#> Individuals:  1_113 won't be plotted
summary(plot_df$df)
#>       id                  x0                y0              x1
#>  Length:262         Min.   :-0.6399   Min.   :1.000   Min.   :-0.6399
#>  Class :character   1st Qu.: 3.0000   1st Qu.:2.603   1st Qu.: 3.0000
#>  Mode  :character   Median : 6.5100   Median :3.096   Median : 7.0050
#>                     Mean   : 6.9439   Mean   :3.146   Mean   : 7.0470
#>                     3rd Qu.:11.0100   3rd Qu.:4.000   3rd Qu.:11.0025
#>                     Max.   :15.0100   Max.   :4.530   Max.   :15.0100
#>                                                       NA's   :146
#>        y1             type               fill              border
#>  Min.   :0.9808   Length:262         Length:262         Length:262
#>  1st Qu.:2.7010   Class :character   Class :character   Class :character
#>  Median :3.0960   Mode  :character   Mode  :character   Mode  :character
#>  Mean   :2.9859
#>  3rd Qu.:3.6030
#>  Max.   :4.2490
#>  NA's   :146
#>      angle        density         cex           label
#>  Min.   : NA   Min.   : NA   Min.   :0.700   Length:262
#>  1st Qu.: NA   1st Qu.: NA   1st Qu.:1.000   Class :character
#>  Median : NA   Median : NA   Median :1.000   Mode  :character
#>  Mean   :NaN   Mean   :NaN   Mean   :1.003
#>  3rd Qu.: NA   3rd Qu.: NA   3rd Qu.:1.000
#>  Max.   : NA   Max.   : NA   Max.   :2.478
#>  NA's   :262   NA's   :262   NA's   :158
#>      tips                lwd             adjx          adjy
#>  Length:262         Min.   :1.000   Min.   :0.5   Min.   :0.5000
#>  Class :character   1st Qu.:1.000   1st Qu.:0.5   1st Qu.:0.5000
#>  Mode  :character   Median :1.000   Median :0.5   Median :1.0000
#>                     Mean   :1.019   Mean   :0.5   Mean   :0.7647
#>                     3rd Qu.:1.000   3rd Qu.:0.5   3rd Qu.:1.0000
#>                     Max.   :2.500   Max.   :0.5   Max.   :1.0000
#>                     NA's   :104     NA's   :160   NA's   :160
#>      lty                 pch
#>  Length:262         Min.   :19
#>  Class :character   1st Qu.:19
#>  Mode  :character   Median :19
#>                     Mean   :19
#>                     3rd Qu.:19
#>                     Max.   :19
#>                     NA's   :260
plot_fromdf(plot_df$df, usr = plot_df$par_usr$usr,
    boxh = plot_df$par_usr$boxh, boxw = plot_df$par_usr$boxw
)