Convert a Pedigree to a legend data frame for it to
be plotted afterwards with plot_fromdf().
Usage
# S4 method for class 'Pedigree'
ped_to_legdf(
  obj,
  boxh = 1,
  boxw = 1,
  cex = 1,
  adjx = 0,
  adjy = 0,
  lwd = 1,
  precision = 4
)
Arguments
- obj
A Pedigree object
- boxh
Height of the polygons elements
- boxw
Width of the polygons elements
- cex
Character expansion of the text
- adjx
default=0. Controls the horizontal text adjustment of the labels in the legend.
- adjy
default=0. Controls the vertical text adjustment of the labels in the legend.
- lwd
default=1. Controls the bordering line width of the elements in the legend.
- precision
The number of significatif numbers to round the numbers to.
Details
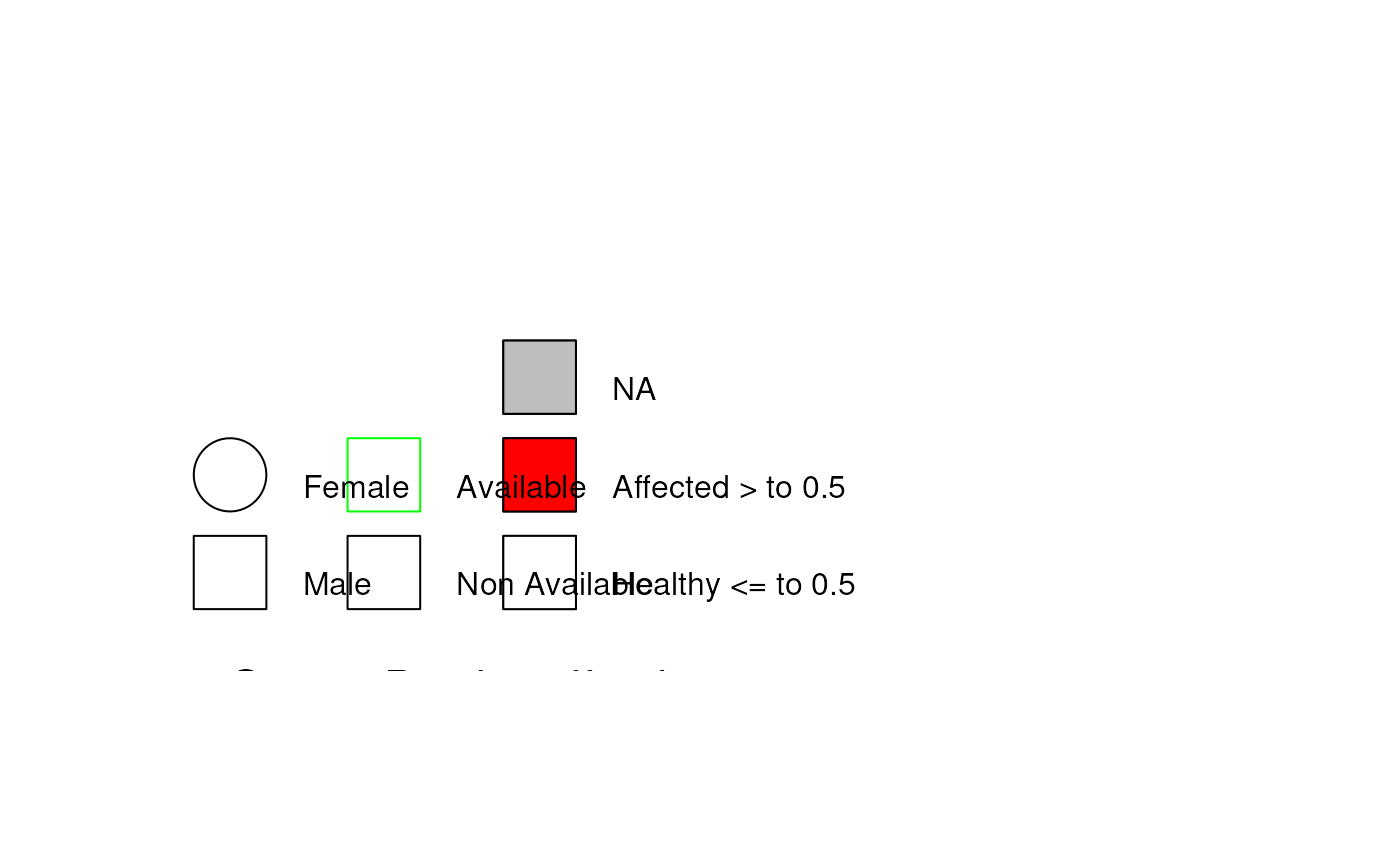
The data frame contains the following columns:
x0,y0,x1,y1: coordinates of the elementstype: type of the elementsfill: fill color of the elementsborder: border color of the elementsangle: angle of the shading of the elementsdensity: density of the shading of the elementscex: size of the elementslabel: label of the elementstips: tips of the elements (used for the tooltips)adjx: horizontal text adjustment of the labelsadjy: vertical text adjustment of the labels
All those columns are used by
plot_fromdf() to plot the graph.
Examples
data("sampleped")
pedi <- Pedigree(sampleped)
leg_df <- ped_to_legdf(pedi)
summary(leg_df$df)
#>       id                  x0              y0               x1
#>  Length:24          Min.   :0.000   Min.   :0.0000   Min.   : NA
#>  Class :character   1st Qu.:1.000   1st Qu.:0.8333   1st Qu.: NA
#>  Mode  :character   Median :3.104   Median :2.1670   Median : NA
#>                     Mean   :2.723   Mean   :1.9376   Mean   :NaN
#>                     3rd Qu.:4.258   3rd Qu.:2.8752   3rd Qu.: NA
#>                     Max.   :5.258   Max.   :4.0000   Max.   : NA
#>                                                      NA's   :24
#>        y1          type               fill              border
#>  Min.   : NA   Length:24          Length:24          Length:24
#>  1st Qu.: NA   Class :character   Class :character   Class :character
#>  Median : NA   Mode  :character   Mode  :character   Mode  :character
#>  Mean   :NaN
#>  3rd Qu.: NA
#>  Max.   : NA
#>  NA's   :24
#>      angle        density         cex           label
#>  Min.   : NA   Min.   : NA   Min.   :1.000   Length:24
#>  1st Qu.: NA   1st Qu.: NA   1st Qu.:1.000   Class :character
#>  Median : NA   Median : NA   Median :1.000   Mode  :character
#>  Mean   :NaN   Mean   :NaN   Mean   :1.136
#>  3rd Qu.: NA   3rd Qu.: NA   3rd Qu.:1.250
#>  Max.   : NA   Max.   : NA   Max.   :1.500
#>  NA's   :24    NA's   :24    NA's   :13
#>      tips                adjx         adjy         lwd
#>  Length:24          Min.   :0    Min.   :1    Min.   :1
#>  Class :character   1st Qu.:0    1st Qu.:1    1st Qu.:1
#>  Mode  :character   Median :0    Median :1    Median :1
#>                     Mean   :0    Mean   :1    Mean   :1
#>                     3rd Qu.:0    3rd Qu.:1    3rd Qu.:1
#>                     Max.   :0    Max.   :1    Max.   :1
#>                     NA's   :11   NA's   :11   NA's   :13
plot_fromdf(leg_df$df, usr = c(-1,15,0,7))